TripleSat Imagery And Its Uses For Land Cover Analysis
By: Suet Yheng Kok, Min Er Nah, Samuel Yeong and Bo Yuan
(21st Century Aerospace Technology (Asia) Pte. Ltd., Singapore)
4 September 2017
ABSTRACT:
The TripleSat constellation, launched on 2015-07-10 by Twenty First Century Aerospace Technology Co. Ltd. (21AT), comprises three identical optical Earth observation satellites with a ground sampling distance (GSD) of less than 1 meter and a ground swath of 23.4 kilometers. The high geometric and radiometric accuracies of the TripleSat imagery enable a wide range of applications. This paper demonstrates the capabilities of qualitative and quantitative land cover analysis using TripleSat images of Singapore and India. To carry out this analysis, the pixel values of the chosen images are first converted to their corresponding radiance values before being atmospherically corrected to retrieve the surface reflectance. These images are subsequently classified and the results show significant improvements in the classification accuracy for the normalized difference vegetation index (NDVI) after atmospheric correction, especially in the overcast vegetated areas.
1. INTRODUCTION
The TripleSat constellation comprises three identical optical Earth observation satellites. Launched successfully on 2015-07-10 from the Indian Satish Dhawan Space Centre (Sun, 2015), it is capable of delivering very high resolution imagery at a ground sampling distance (GSD) of less than 1 m for the panchromatic band (450-650 nm) and 4 m for the multispectral bands (B:440-510, G:510-590, R:600-670, NIR:760-910 nm). The three satellites are phased 120° apart in the same 650 km high sun-synchronous orbit, with their agile off-pointing capability of ±45° and a swath width of 23.4 km. It is capable of targeting any place on Earth daily in a single pass. This optimal combination of spatial and temporal resolutions make it possible to efficiently deliver timely remote sensing data and information. This is crucial for applications such as land use/cover monitoring and change detection.
As the imaging products of TripleSat have high geometric and radiometric accuracies, they can be used for qualitative and quantitative analysis in a wide range of applications. The digital packaging of the imaging products are designed to comply with the industry standards and be convenient yet comprehensive for end users. For instance, the digital numbers (DN) retain the radiance ratios among the multispectral bands in Level 1 products, which is unique among the current commercial optical satellite imagery offerings.
To demonstrate the product quality of the TripleSat imagery and its usefulness for applications that require qualitative and quantitative measurements, this paper presents a typical land cover analysis at two study areas in India and Singapore, as shown in Figure 1.
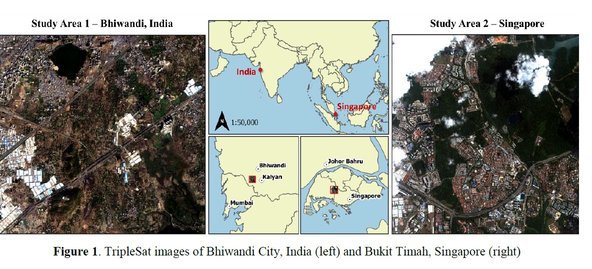
The first study area is Bhiwandi City (19.284°N, 73.067°E) in the western state of Maharashtra, India. It is located approximately 32 km inland and situated by the Ulhas River. The climate in Bhiwandi is classified as tropical monsoon, with short dry season and significant rainfall around June to September. Land area in the city is rarely used for cultivation and has been developing into industrial areas. Bhiwandi City’s main income is generated by the textile industry and the e-commerce industry, thus accounting for the large number of warehouses and buildings housing power looms and workers (Shaikh, 2015).
The second study area is an estate in Bukit Timah (1.344°N, 103.773°E), Singapore. It is a mixture of commercial, residential and recreational land use. Located within this area, Bukit Timah Nature Reserve comprises one of the largest patch of tropical rainforest in the country. As an equatorial country, Singapore often experiences overcasts caused by extensive convective clouds during the passage of a Sumatra squall.
2. LAND COVER ANALYSIS
This case study on land cover analysis utilized 4-m multispectral TripleSat images that were acquired over India and Singapore on 2015-12-23 and 2016-03-31, respectively. Multispectral images were used to investigate if there was any significant difference in the classification results based on radiance and surface reflectance values. The normalized difference vegetation index (NDVI) was calculated to evaluate the impact of atmospheric correction on vegetation indices.
Reflectance is defined as the ratio of solar radiation reaching the surface to the amount of radiation leaving the surface (Shippert, 2013). It can be separated into top of atmosphere (TOA) reflectance that includes reflectance from the clouds and atmosphere and surface reflectance, the physical quantity of the object material alone to absorb radiation. Both radiance and TOA reflectance values are affected by the absorption and scattering of gaseous molecules and aerosols in the atmosphere that impedes the amount of radiation captured by the satellites. Images of the same area may appear different depending on the day and time taken. The difference may influence multi-temporal studies especially in the comparison of locations with fast changing weather conditions. Atmospheric correction needs to be done to calculate surface reflectance which is a better unit that is common in space and time for analysis (Song, 2001) as compared to radiance which is the amount of radiation reaching the surface for that time period only.
The overall workflow of the case study is presented in Figure 2. The sub-setting of georeferenced images was performed to extract a 5 by 5 km area of study from each image. Radiometric correction was subsequently applied to rectify the pixel values and the images were converted into radiance and reflectance values. To eliminate the atmospheric effects in the images, radiance values were converted to surface reflectance using atmospheric correction algorithm that employed radiative transfer model. The model accounts for spatial variation in the atmosphere, which can effectively calculate the scattering and absorption signatures based on specific scene location, date and time. Some critical atmospheric parameters such as water vapor, aerosol optical depth and visibility were incorporated to compute accurate surface reflectance without ground measurements.
In the land cover classification process, supervised classification technique with maximum likelihood classifier was applied to all radiance and surface reflectance maps. Training sites were generated for water, vegetation, built up, bare earth, and cloud classes and the same training file was used for all classification to create comparable land cover
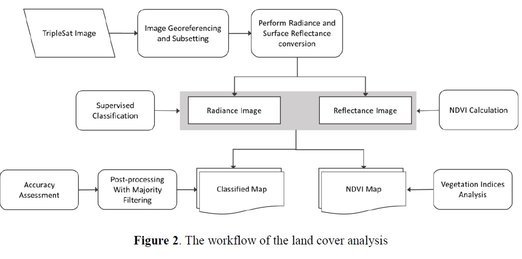
maps. To evaluate the classification results, accuracy assessment was performed to obtain the reliability and accuracy of the maps derived from radiance and surface reflectance images. Calculation of standard normalized difference vegetation index (NDVI) was performed simultaneously for both images to further inspect the influence of atmospheric effects on the vegetation class. The difference between NDVI values was assessed with 25 random points plotted on the vegetated areas. Validity of study for both land cover classifications and NDVI analysis were done based on visual interpretation and user adopted stratified random sampling method to create random points representing different land cover classes.
3. RESULTS AND DISCUSSION
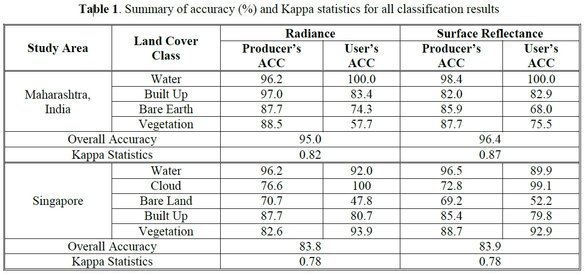
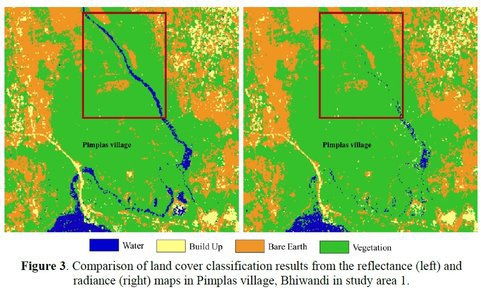
The classification accuracy of radiance and surface reflectance maps for study area 1 (Bhiwandi, India) and 2 (Bukit Timah, Singapore) were summarized in Table 1. Based on the results for Bhiwandi, the classified radiance and surface reflectance maps have a similar appearance and was substantiated by the accuracy assessment levels, 95.0% and 96.4% respectively. For individual class accuracies, an increment of producer accuracy of around 2.2% was achieved for water, showing that surface reflectance values is a better gauge for classifying the water class due to the better defined stream and small water bodies. Kawata et al. (1990) also suggested that accuracy in water bodies was improved for surface reflectance maps. As shown in Figure 3, the clarity of the stream leading from the Ulhas River can be noticeably seen in the classified surface reflectance map but not in the classified radiance map.
Similar results were observed in the study for Singapore. The accuracy difference between radiance and surface reflectance maps was only 0.1%. This showed that the impact of atmospheric correction on overall land cover
classification was insignificant. However, the result of vegetation class improved slightly as an increment of producer’s accuracy of around 6% was achieved in the surface reflectance map. This indicates that atmospheric correction has a potentially important role to play in delineating vegetation cover.
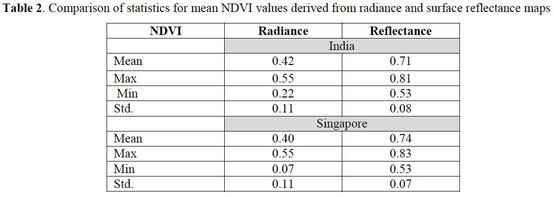
Data analysis has been done on the set of NDVI values derived from radiance and reflectance maps. For both India and Singapore studies, the absolute NDVI values was about 0.30 – 0.34 higher for surface reflectance map than for the radiance map. Based on the paired t test, the difference between the two NDVI was significant at 95% confidence interval with P <0.05. Cohen’s effect size was > 0.8, proving that atmospheric correction does have a huge effect on the difference in NDVI values for vegetation. This result is in line with studies by Agapiou et al. (2011) and Parente (2013) where NDVI values based on reflectance maps were higher as compared to radiance values. Table 2 shows a descriptive statistics of NDVI values before and after atmospheric correction for India and Singapore study areas, respectively.
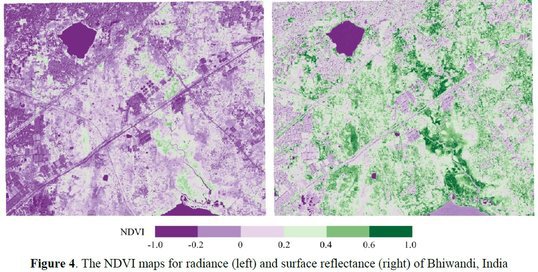
According to Song et al. (2001), TOA reflectance values still tend to be overestimated on dark features like vegetation and underestimated on bright objects, resulting in missing information. Surface reflectance maps are needed for calculating accurate values of NDVI for vegetation and atmospheric correction is vital for minimizing the error caused by atmospheric effects when comparing multi temporal images (Hadjimitsis, 2010). As is shown in Figure 4, more vegetated areas can be distinguished from the reflectance map, with a NDVI threshold of 0.2.
Further evidence regarding the impact of atmospheric correction on NDVI values was shown in the analysis of vegetation indices on the overcast forest reserve area in Singapore study. Results indicated that on average the NDVI of atmospherically corrected images was much higher at 0.59 than the uncorrected images at 0.14 in the cloud shadow affected vegetation areas, as shown in Figure 5. Such observation has also been reported in previous study by Maxwell et al. (2012), where zones of clouds and cloud shadows have generally low values of NDVI (less than 0.2) in the at-sensor reflectance map. In this case, NDVI values that are less than 0.2 in overcast vegetated areas of radiance map would be classified as non-vegetated areas. In contrast, for the same area in the reflectance map, the NDVI values
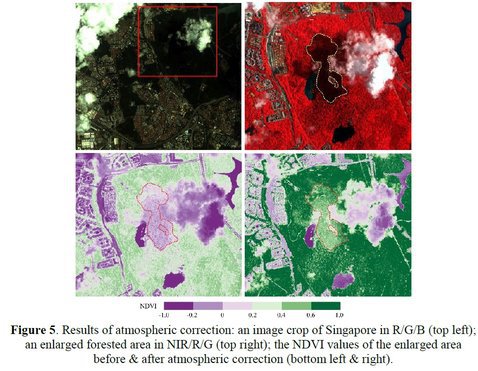
typically range from 0.4 to 0.8 indicating a dense vegetation canopy (USGS, 2016). It is apparent that reflectance maps are needed for calculating accurate values of NDVI for vegetation and absolute atmospheric correction is vital for preventing misinterpretation.
4. CONCLUSION REMARKS
A major issue on the use of remotely sensed image for studies of Earth’s surface lies in the effect of scattering and absorption by particles in the atmosphere and sensor calibration. To reduce the noise in the image, radiometric calibration and correction (i.e. atmospheric correction) are required in order to obtain meaningful units of radiance and reflectance for remote sensing studies. Depending on the purpose of study and information desired, calibration of image data to surface reflectance units is optional.
Classified surface reflectance maps overall have similar accuracies to that of the classified radiance maps, which concurs with Song et al. (2001) where if the training data and the single date data to be classified using maximum likelihood are of the same relative scale, atmospheric correction is unnecessary. Using radiance map is adequate in this case. On top of that, DN values for TripleSat images are calibrated to values relative to radiance, therefore TripleSat images can be used for information extraction directly without performing any data conversions.
In contrast, removal of atmospheric effects is an important pre-processing step in applications such as vegetation cover monitoring and investigation of the change in vegetation dynamics. This paper thus also highlights the significance of atmospheric correction, especially in which NDVI is used for study in overcast vegetated areas and monitoring long term land cover changes.
Since its first service to this day, the TripleSat constellation has acquired nearly 92,000 ground scenes, each measured about 576 km2. The high geometric and radiometric qualities of its imagery will contribute to the development of human society for the next 7 years and beyond.
ACKNOWLEDGEMENT
The authors would like to thank Dr. Tiangang Yin and Prof. Leslie Norford of Center for Environmental Sensing, Singapore-MIT Alliance for Research and Technology (SMART) for their kind assistance in the physical modelling and numeric evaluation of the atmospheric correction part of this work.
REFERENCES
Agapiou, A., Hadjimitsis, D., Papoutsa, C., Alexakis, D. & Papadavid, G., 2011. The Importance of Accounting for Atmospheric Effects in the Application of NDVI and Interpretation of Satellite Imagery Supporting Archaeological Research: The Case Studies of Palaepaphos and Nea Paphos Sites in Cyprus. Remote Sensing, 3, pp. 2605-2629.
Hadjimitsis, D. G., Papadavid, G., Agapiou, A. & Themistocleous, K., 2010. Atmospheric correction for satellite remotely sensed data intended for agricultural applications: Impact on vegetation indices. Natural Hazards and Earth System Sciences, 10, pp. 89–95.
Kawata, Y., Ohtani, A., Kusaka, T. & Ueno, S., 1990. Classification Accuracy For The MOS-1 MESSR Data Before And After The Atmospheric Correction. IEEE Transactions on Geoscience and Remote Sensing, 28(4), pp. 755-760.
Maxwell, S. K. & Sylvester, K.M., 2012. Identification of "ever-cropped" land (1984-2010) using Landsat annual maximum NDVI image composites: Southwestern Kansas case study. Remote Sensing of Environment, 121, pp. 186-195.
Parente, C., 2013. TOA Reflectance and NDVI calculation for Landsat 7 ETM+ images of Sicily. The 2nd Electronic International Interdisciplinary Conference, pp. 351-354.
Shaikh, Z., 2015. It has power looms, it powers the e-commerce boom, yet Bhiwandi remains a backwater. The Indian Express. Retrieved on 2016-08-20 from http://indianexpress.com/article/mumbai/it-has-power-looms-it-powers-the-e-commerce-boom-yet-bhiwandi-remains-a-backwater/
Shippert, P., 2013. Digital Number, Radiance, and Reflectance. Harris Geospatial Solutions. Retrieved on 2016-08-20 from http://www.harrisgeospatial.com/Home/NewsUpdates/TabId/170/ArtMID/735/ArticleID/13592/Digital-Number-Radiance-and-Reflectance.aspx
Song, C., Woodcock, C., Seto, K., Lenney, M. & Macomber, S., 2001. Classification and Change Detection Using Landsat TM Data: When and How to Correct Atmospheric Effects? Remote Sensing of Environment, 75, pp. 230-244. Sun, W., 2015. 21AT and Its TripleSat Constellation Services. The 36th Asian Conference on Remote Sensing (ACRS’15).
USGS, 2016. Frequently Asked Questions about the LandSat Missions. Retrieved on 2016-08-22 from http://landsat.usgs.gov/how_is_radiance_calculated.php: http://landsat.usgs.gov/how_is_radiance_calculated.php

