Crop Monitoring Using Multispectral Optical Satellite Imagery
By: Randy Chua, Xie Qingbin and Yuan Bo
(21st Century Aerospace Technology (Asia) Pte. Ltd., Singapore)
25 October 2017
ABSTRACT: This paper details the validity of utilizing a color-based approach to monitor cotton crop readiness. By harnessing the TripleSat Constellation’s 0.8m resolution multispectral imagery, this paper introduces how the maturing of cotton plants can be captured through non-conventional methodologies: employing the usage of the visible spectral bands to detect the change in the plantation’s surface reflectance. Through the experiment, it was discovered that the red wavelength band (600-670nm) responded most significantly to cotton’s phenological changes during the maturing phase. A hypothetical index is thus constructed to detect this physical change in cotton plantations. This allows for stakeholders to better monitor cotton readiness, and also to pre-empt incoming harvesting seasons over large areas simultaneously. This paper constitutes a portion of 21AT’s engagement with agricultural research, using high-resolution imagery to further improve this field of study, be it in enhanced crop monitoring, crop health management, soil studies, or land suitability evaluations.
1. INTRODUCTION
Remote Sensing and Cotton
Recent advances in remote sensing technologies have enabled agricultural stakeholders and researchers to set their sights further and wider in a literal sense. With their ability to collect “temporally and spatially continuous data over much of the globe” (Tucker & Choudhury, 1987) in a short amount of time, remote sensing has become a main driver of the proliferating academic research into crop monitoring and management today. Not only do optical satellites capture large swaths of agricultural lands at once, the multispectral wavelength bands that the images can capture also provide researchers with information traditionally not visible to the naked eye.
Cotton is one of the many beneficiaries from the advancement of remote sensing technology. As an important raw material in the global textile trade, cotton as a cash crop became widely cultivated in many parts of the world today, such as India, China, Australia, and the United States. By drawing upon various vegetation indices and proxies from multispectral imagery, studies were conducted to extract insights on cotton crops, be it predictions of cotton yields (Liu et al, 2016; Domenikiotis et al, 2004; Dalezios et al, 2001), cotton growth monitoring (Bai et al, 2011; Zhao et al, 2007), or the detection of cotton crop stress (Reisig et al, 2015), among others.
Beyond the standard arrays of crop monitoring methodologies, more can be done to exploit the cotton plant’s unique phenological stages, using high-resolution remotely sensed data. Past research traditionally utilized low to medium resolution satellite images, such as the NOAA/AVHRR (1km), MODIS (250m), or Landsat (30m) imagery. It has been suggested that finer resolution allows for more precise extent delineations and observations (Mkhabala et al, 2011). This paper introduces the TripleSat Constellation, a trio of satellites capable of capturing multispectral imagery of up to 0.8-meter resolution within the visible-NIR wavelengths (21AT, 2015). This reveals greater feature heterogeneity on the ground, allowing for studies and analyses to be conducted with greater precision and efficiency.
Objective
This paper discusses the viability of using a color-based phenological index to monitor cotton’s changing spectral reflectance throughout its growth stages. A typical cotton plant undergoes stages of growth from seed planting to maturity, with changing characteristics (Cotton Australia, 2013). When the cotton boll approaches maturity, it will reveal the white cotton fiber underneath, enveloping the cotton field with a layer of white as it signals the start of the harvesting period. This period is important for farmers, as the cotton lint is susceptible to damages from fungi and rain once out in the open. Thus, timely and accurate knowledge on the boll opening period is useful for making management decisions on the plantations.
Based on observations from different regional cotton plantations, the visible wavelengths captured by high-resolution satellite imagery can serve as an indicator to cotton crop readiness, through monitoring changes along time series satellite data. Following an introduction to the study regions used in this research, the methodological approaches and results will be discussed, before evaluating the applicability and future potential of remote sensing and agricultural studies.
STUDY REGIONS
Australia
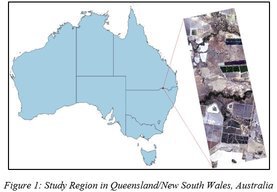
As the world’s second largest cotton exporter (Cotton Australia, 2013), majority of the cotton plantations are located in the states of Queensland and New South Wales, where distinct wet/dry subtropical seasons prevail. Cotton seeds are generally planted during the start of the wet season in October/November, and picked between April to June when the climate turns drier. The plantations are usually rain-fed during the wet season, although irrigation and water storage dams are also required due to cotton’s high water intake. The selected study area in Australia is in the Goondiwindi region, along the borders of the two states (Fig. 1), where large swaths of cotton plantations can be found.
China
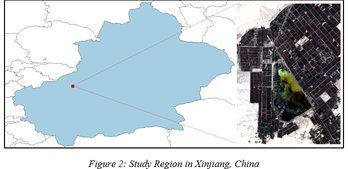
One of the world’s largest cotton producers alongside India, China’s cotton production is largely centered in the Xinjiang Autonomous Region, though pockets of cotton fields can be found in Central China along the major river basins. The study area chosen is in the Aksu Prefecture of Xinjiang (Fig. 2), a cold desert climate with large seasonal temperature variations. Unlike Australia, the cotton crops here are planted in April and harvested by October.
METHODOLOGY
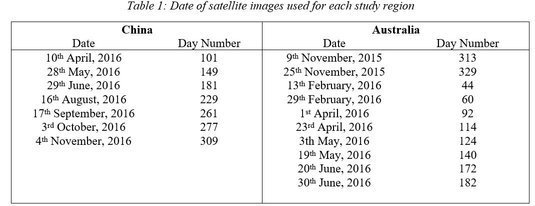
Satellite images were selected at regular intervals within each region’s growing seasons. To accurately capture the changing physical characteristics of the phenological stages, monthly or fortnightly intervals are more ideal (ACE, 2016). However, due to the lack of available cloud-free images from archives, the images were largely selected based on availability. In some cases, Landsat 8 OLI satellite images were used to maintain a regular time interval. Table 1 shows the dates of the images that were used for the study.
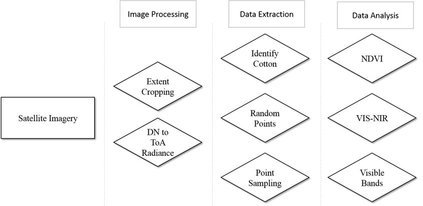
The raw satellite imagery obtained were first cropped to the intended spatial extent within the. The digital numbers (DN) were then converted into radiance values (Lλ), using the following formula:
The Landsat’s gain and bias values for individual scenes can be found in the respective metadata files (USGS, 2017). For the TripleSat images, they were already pre-processed and converted into radiance values, and thus can be used directly.
Peak vegetative signals for cotton crops are usually observed during the mid-late growth periods of a cotton cycle, corresponding to the emergence of squares (Liu et al, 2016; Bai et al, 2011). Normalized Difference Vegetation Index (NDVI) images were calculated from scenes that fall within this period for each region, which allows for the easier identification of cotton crops. 30 random points were then selected from the identified cotton plantations using the NDVI composites as masks. These points were used to extract the local pixel values from each satellite scene to produce a time series dataset.
RESULTS
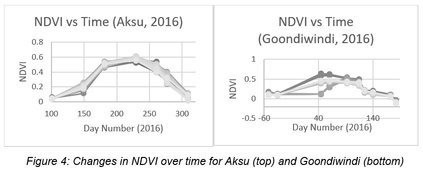
Comparison of NDVI changes of time
NDVI has been the standard go-to vegetation index for most crop monitoring studies (Son et al, 2014; Mkhabela et al, 2011; Robson, A., 2010; Dalezios et al, 2001). Figure 4 demonstrated how different rates of cotton growth can be observed through variations in NDVI values, especially in Goondiwindi. However, NDVI does not give conclusive signals with regards to cotton maturity, with a general downward trend for all plots following peak NDVI during mid-season. Thus, an alternative method is required to distinguish the boll-opening period for cotton.
Comparison of VIS-NIR bands over time
Figures 5 and 6 plot variations of individual spectral band (Blue, Green, Red, Near-infrared Red) along the time series for the 30 selected points in each study region.
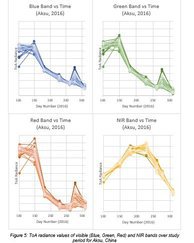
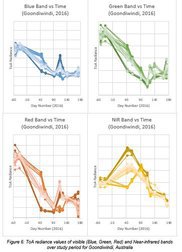
It was observed that while the NIR bands followed roughly the same trend as their respective NDVI curves, it was not the case for the visible bands. In fact, it was noted that all the selected cotton plantation points witnessed an increase in their visible spectral radiance values towards the end-season. For the Aksu study area, this increase was around late-September to early-October, which happened to be right before the region’s harvesting season in 2016 (Xinhua, 2016). Goondiwindi, on the other hand, with the presence of multiple small landownership, saw two different increases in the months of April and May, a likely result of different seeding timings and farming techniques.
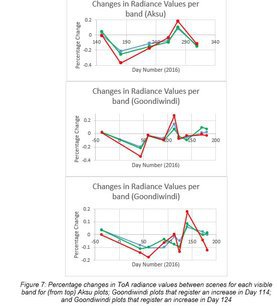
Figure 7 went on to evaluate the most viable visible band for distinguish cotton readiness, through comparing the relative changes in radiance values across the scenes, for each study region. An average radiance value for each scene per band was obtained, and plotted. The selected points in Goondiwindi were divided into two graphs to differentiate between plantations that had a visible spectral radiance increase in Day 114 (23rd April), and Day 124 (3rd May). The results showed that out of the three colored visible bands, the red band (600-670nm) had the largest percentage increase across all three areas during the suggested readiness period.
DISCUSSION
From the results in the previous section, the red spectral band in a multispectral satellite imagery appears to be the most viable indicator of cotton crop readiness. This is supported by the fact that during the period close to harvesting, the exposed cotton lint will have significantly different spectral reflectance as compared to the surrounding foliage or soil. The white surface due to the cotton lint is capable of reflecting more incoming solar radiation rather than absorbing for photosynthesis, thus allowing airborne satellites to capture this change. Out of the three visible bands in standard multispectral satellite like the TripleSat, red light registers the largest change, likely due to the fact that plants usually absorb relatively more energy within the red electromagnetic spectrum, and thus provide the strongest signal change. This paper suggests the following simple linear index as an indicator of cotton crop readiness:

where i is the current satellite scene, and j is the previous scene. This index applies to areas that are already identified as cotton farms and plantations, and redundant areas should be cropped out.
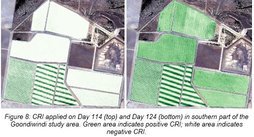
To demonstrate the proposed index, the 1st April, 23rd April and 3rd May’s 0.8m resolution scenes in Goondiwindi were used to evaluate crop readiness in Day 114 and Day 124 (Fig. 8). From the results, three out of eight plots in the sub-area experienced positive CRI, while the other plots only saw this change ten days after, signaling that these plots were likely to be ready for harvesting earlier than their surrounding plots. In particular, it is noteworthy that this result also highlighted the possible alternate cotton strip planting practices in Australia: where conventional cotton is planted alongside transgenic cotton to discourage cotton pest growth (Cotton Australia, 2013). This can be seen from alternating strips turning “green” in the bottom plots between both dates.
CONCLUDING REMARKS
This research is part of an overall effort to better integrate the technology of high-resolution, remotely sensed multispectral imagery into the field of agricultural studies. Using the 0.8m resolution TripleSat imagery, this paper evaluated the usefulness of employing less-commonly used visible spectral bands to monitor the readiness of cotton crop in the regions of Australia and China. This strand of research can be further fine-tuned and improved upon with more available datasets of alternative regions in the near future.
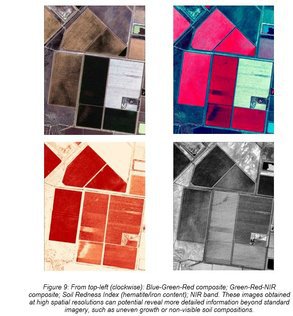
As high-resolution images continue to be made available in different regions, it is possible to derive further useful insights and better monitoring strategies for agricultural purposes (Fig. 9). As such, the authors are continuously committed to engage further agricultural research through the lens of high-resolution satellite imagery.
REFERENCES
ACE, 2016. Growth and Development of a Cotton Plant. Retrieved 20th August, 2017, from http://www.cotton.org/tech/ace/growth-and-development.cfm
Bai, J., Li, J., & Li, S. (2010). Monitoring the plant density of cotton with remotely sensed data. In International Conference on Computer and Computing Technologies in Agriculture (pp. 90-101). Springer, Berlin, Heidelberg.
Cotton Australia (2013) Cotton Education Kit. Retrieved 27th August, 2017, from http://cottonaustralia.com.au/uploads/resources/Cotton_Australia_Education_Kit_-_Secondary.pdf
Dalezios, N. R., Domenikiotis, C., Loukas, A., Tzortzios, S. T., & Kalaitzidis, C. (2001). Cotton yield estimation based on NOAA/AVHRR produced NDVI. Physics and Chemistry of the Earth, Part B: Hydrology, Oceans and Atmosphere, 26(3), 247-251.
Domenikiotis, C., Spiliotopoulos, M., Tsiros, E., & Dalezios, N. R. (2004). Early cotton yield assessment by the use of the NOAA/AVHRR derived Vegetation Condition Index (VCI) in Greece. International Journal of Remote Sensing, 25(14), 2807-2819.
Liu, Q. S., Li, X. Y., Liu, G. H., Huang, C., & Guo, Y. S. (2016). Cotton Area and Yield Estimation at Zhanhua County of China Using HJ-1 EVI Time Series. In ITM Web of Conferences (Vol. 7, p. 09001). EDP Sciences.
Mkhabela, M. S., Bullock, P., Raj, S., Wang, S., & Yang, Y. (2011). Crop yield forecasting on the Canadian Prairies using MODIS NDVI data. Agricultural and Forest Meteorology, 151(3), 385-393.
Reisig, D. D., Reay-Jones, F. P. F., & Meijer, A. D. (2015). Aggregation and Association of NDVI, Boll Injury, and Stink Bugs in North Carolina Cotton. Journal of Insect Science, 15(1), 134.
Robson, A. (2010, September). Remote sensing applications for the Australian Cotton industry. Paper presented at 14th Annual Symposium of Precision Agriculture in Australasia, NSW.
Son, N. T., Chen, C. F., Chen, C. R., Minh, V. Q., & Trung, N. H. (2014). A comparative analysis of multitemporal MODIS EVI and NDVI data for large-scale rice yield estimation. Agricultural and forest meteorology, 197, 52-64.
Tucker, C. J., & Choudhury, B. J. (1987). Satellite remote sensing of drought conditions. Remote sensing of Environment, 23(2), 243-251.
USGS. (2017). Using the USGS Landsat 8 Product. Retrieved 20th August, 2017, from https://landsat.usgs.gov/using-usgs-landsat-8-product
Xinhua. (2016). Cotton harvest to finish at end of October in Tarim Basin, China’s Xinjiang. Retrieved August 22nd, 2017, from http://www.globaltimes.cn/content/1013680.shtml
Zhao, D., Reddy, K. R., Kakani, V. G., Read, J. J., & Koti, S. (2007). Canopy reflectance in cotton for growth assessment and lint yield prediction. European Journal of Agronomy, 26(3), 335-344.
21AT. (2015). TripleSat Constellation. Retrieved 20th August, 2017, from http://www.21at.sg/TripleSatelliteConstellation.html

