Ship Dimension Estimation From Optical Satellite Imagery
By: Huang Dezhao and Yuan Bo
(21st Century Aerospace Technology (Asia) Pte. Ltd., Singapore)
4 September 2017
ABSTRACT: Ship detection using optical satellite imagery is a challenging task. One of its most important post-processing operations is to estimate the dimensions of the detected ships. The convention is to use the upright bounding box of a detected ship to indicate its extents, and to use the center of the upright bounding box to indicate its location. Due to different headings of ships, upright bounding boxes are usually not suitable for close estimation of ship dimensions. This paper uses the best-fit bounding box of a detected ship to estimate its beam and length overall. The best-fit bounding box of a ship is the one with the minimum area among all its bounding boxes and reveals many important properties of a ship, such as its length-to-beam ratio and heading. In a ship detection process, complex scene compositions and excessive noises may cause false pixels being included as parts of a ship. These defects can cause false alarms or inaccurate assessment of ships using their best-fit bounding boxes. This paper proposes a practical solution to this problem by using trimmed projected profiles of a ship in a rotating Cartesian coordinate system to obtain its best-fit bounding box. Experimental results show that using the best-fit bounding box with trimming provides a more accurate estimation of ship dimensions. As a byproduct, the settings of a number of parameters in the ship detection pipeline become less sensitive than using the best-fit bounding box without trimming, resulting in more robust ship detection results.
1. INTRODUCTION
Ship detection from satellite imagery has long been used in fishery management and maritime surveillance. There are two signal types of satellite imagery in common use: microwave in the S/C bands, and optical in the visible/near-infrared bands. On the microwave front, the Synthetic Aperture Radar (SAR) satellite imagery has been extensively used in ship detection (Crisp, 2004; Han, 2004). The “All-Weather, All-Day” capability and the high contrast between the bright ship targets and the dark sea background are particularly beneficial for getting efficient and robust results. On the optical front, the spatial resolutions of the imagery are higher and the costs are lower than that of SAR typically. More and more optical satellites with very high spatial resolutions are providing Earth observing services, among which is the TripleSat constellation that consists of three identical optical satellites (Sun, 2015). The downsides of using optical satellite imagery in ship detection include cloud covers especially in the tropical region, sun illumination dependence, complex sea reflectance patterns, and ship wakes. This paper is part of an effort to use optical satellite imagery for ship detection.
Typical ship detection procedures using optical satellite imagery can be described as the following: given an optical satellite image, its panchromatic band or one of the multispectral bands is chosen for processing. A land mask, which can be constructed from a coastline dataset, is used to expose only sea areas for ship detection. Image binarization is then performed to separate the dark pixels of the sea areas from the bright pixels of the ship targets. For evaluating the intensity thresholds for image binarization, global thresholding (Lin, et al., 1997) is a simple yet effective way for sea areas that are mostly homogeneous, while adaptive thresholding (Wackerman, 2001) can give better performances when the sea areas are large and complex. Connected Component Analysis (Yuan, 2005) is applied to the binarized image and the results are subject to component grouping and filtering so that obvious false alarms can be removed and the surviving connected components are most likely to be ship targets.
Many properties can be extracted from the detected ship targets. The dimensions of a ship are not only among the most important properties of a ship, but also useful during the component filtering stage of the ship detection pipeline. There are several ways to represent the dimensions of the ship targets. The most commonly used geometry is the upright bounding box or the minimum bounding rectangle that covers all pixels of a target. Due to different headings of ships, upright bounding boxes are usually not suitable for close estimation of ship dimensions. A better approach is to use the best-fit bounding box (Yuan, 2006) to estimate the dimensions and orientations of a ship target. The aspect ratios of the best-fit bounding boxes can also be used in the filtering stage of the ship detection pipeline, as the outer shapes of ships are restricted by fluid dynamics.
2. THE BEST-FIT BOUNDING BOX WITH TRIMMING
The best-fit bounding box of an object is the bounding box with the minimum area (Yuan, 2006). It is translation and rotation invariant. The best-fit bounding box can be used to estimate certain important features of a ship, such as the rectangularity (Sonka, 2014) and the length-to-width ratio. The best-fit bounding box of an object can be determined by incrementally rotating a Cartesian coordinate system in the range from 0 to 90 degrees and building the projected profiles along the two coordinate axes. When the product of the spans of the projected profiles reaches the minimum, the corresponding angle of rotation is the orientation of the best-fit bounding box, of which the sides are the dimensions of the contained object. However, if there are any extrusions from the exterior of an object, be they detection noises or genuine attachments, the best-fit bounding box may become unreliable.
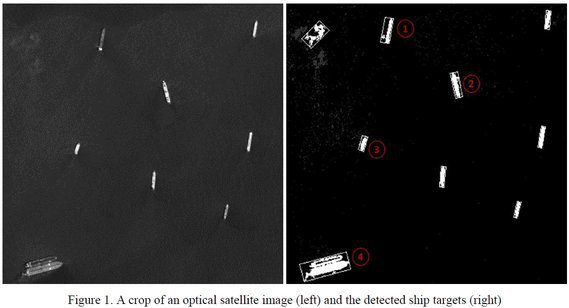
Figure 1 demonstrates the ship detection process using an image crop from an optical satellite. To extract the ship targets, Connected Component Analysis (Shapiro, 2001) is applied to the image crop with a suitable binarization threshold. The resultant components are subsequently filtered by their sizes to remove those unlikely to be parts of a ship. The best-fit bounding boxes of the remaining components are thus generated. Another round of filtering is performed to remove components that are out of specs as ships. The detection results with the corresponding best-fit bounding boxes are shown on the right side of Figure 1. It can be seen that targets 1 to 4 have some extrusions along their perimeters and their best-fit bounding boxes are less tightly fit to the ships. Proper trimming is necessary.
In fact, the trimming operation can be carried out in the same process of finding the best-fit bounding boxes. As shown in Figure 2, trimming starts from both ends of a projected profile towards the center. Let d be the density of an interval of the projected profile along  or
or  axes,
axes, be the average density of the respective projected profile, and k be an adjustable parameter. The corresponding pixels will be trimmed off from the component if
  Trimming will stop at the interval where
 The length of this side of the bounding box at the current angle of rotation will be adjusted accordingly. When both projected profiles are trimmed, the area of the resultant bounding box is used in finding the best-fit bounding box.
Two sample images from SPOT-5 and TripleSat are tested for ship detection using the best-fit bounding box with and without trimming. Shape feature descriptors or filters used in the ship detection include: (1) size, or component area, which is the number of pixels in the component; (2) aspect ratio, which is the ratio between the longer side and the shorter side of the best-fit bounding box; (3) rectangularity R, which is the ratio of the component area divided by the area of the best-fit bounding box (Sonka, 2014). The size filter is used to remove small components which are too small to be ships. In this test, it is set to be 30 for the SPOT-5 image and 100 for the TripleSat image as the latter has higher resolution. The range of aspect ratio is set to be between 2 to 30, which is wide enough to include the majority of ships. The rectangularity of the ship detection without trimming is set relatively low to reduce missed ship target rate with a consequence of higher rate of false ship target alarms. The ship detection results are collectively shown in Figure 3 where the ship targets observed visually in original images are displayed in row 1, the corresponding ship target components from automatic ship detection without trimming and with trimming are displayed in row 2 and row 3 respectively. The first four ship targets are from SPOT-5 image and the last four are from the TripleSat. Rectangularity value of each detected ship target component is attached under it for quantitative analysis. It is visually clear that the best-fit bounding boxes of ship targets with trimming are much tighter and better fit to the corresponding ship bodies than their counterparts without trimming. Rectangularity of the ship targets has been increased dramatically with the proposed trimming algorithm. The higher rectangularity value separates true ship targets further with those false alarms so the threshold of rectangularity descriptor can be set higher to more effectively exclude false targets. For example, the component on the upper left corner of Figure 1 (right), which has a rectangularity of 0.41, was detected as a ship target incorrectly and can be easily removed by a higher rectangularity threshold.

3. CONCLUSION
This paper proposes an algorithm to trim off extraneous pixels in a connected component during the process of finding its best-fit bounding box. Test results show that the proposed algorithm can help getting a more accurate and robust estimation of ship dimensions using optical satellite imagery.
The proposed algorithm can also provide other benefits beside the ship dimension estimation. In the connected component analysis stage, the image binarization threshold value cannot be set low enough to let pass all pixels that belong to ship targets without causing excessive false alarms from other parts of the image. With the proposed trimming algorithm in place, the binarization threshold can be lowered considerably, as the extraneous noises can be mostly eliminated at a later stage of projected profile trimming.
REFERENCES
Corbane, C., Najman, L., Pecoul, E., Demagistri, L. and Petit, M., 2010. A complete processing chain for ship detection using optical satellite imagery.International Journal of Remote Sensing, 31(22), pp.5837-5854.
Crisp, D.J., 2004. The state-of-the-art in ship detection in synthetic aperture radar imagery (No. DSTO-RR-0272). Defence Science And Technology Organisation Salisbury (Australia) Info Sciences Lab.
Han, Z., and Chong J., 2004. A review of ship detection algorithms in polarimetric SAR images. In Signal Processing, 2004. Proceedings. ICSP'04. 2004 7th International Conference on Vol. 3, pp. 2155-2158.
Lin, I.I., Kwoh, L.K., Lin, Y.C. and Khoo, V., 1997. Ship and ship wake detection in the ERS SAR imagery using computer-based algorithm. IEEE 1997 International Geoscience and Remote Sensing Symposium (IGARSS’97), pp. 151-3.
Makedonas, A., Theoharatos, C., Tsagaris, V., Anastasopoulos, V. and Costicoglou, S., 2015. Vessel Classification in Cosmo-Skymed SAR Data Using Hierarchical Feature Selection. The International Archives of Photogrammetry, Remote Sensing and Spatial Information Sciences, 40(7), p.975. Figure 2. Finding the best-fit bounding boxes (left) and with the proposed trimming algorithm (right)
Malthus, T.J. Mumby, P.J., 2003. Remote sensing of the coastal zone: an overview and priorities for future research. International Journal of Remote Sensing, pp. 2805-2815.
Shapiro, L.G. and Stockman, G.C., 2001. Computer Vision. Prentice-Hall, pp. 57-63.
Sonka, M., Hlavac, V. and Boyle, R., 2014. Image processing, analysis, and machine vision. Cengage Learning, pp. 356-358.
Sun, W., 2015. 21AT and Its TripleSat Constellation Services. The 36th Asian Conference on Remote Sensing (ACRS’15).
Wackerman, C.C., Friedman, K.S., Pichel, W.G., Clemente-Colón, P. and Li, X., 2001. Automatic detection of ships in RADARSAT-1 SAR imagery. Canadian Journal of Remote Sensing, 27(5), pp.568-577.
Yuan, B., Kwoh, L.K. and Tan, C.L., 2006. Finding the best-fit bounding boxes. In International Workshop on Document Analysis Systems, pp. 268-279.
Yuan, B. and Tan, C.L., 2005. A multi-level component grouping algorithm and its applications. In IEEE 8th International Conference on Document Analysis and Recognition (ICDAR'05), pp. 1178-1181.
Zhu, C., Zhou, H., Wang, R. and Guo, J., 2010. A novel hierarchical method of ship detection from spaceborne optical image based on shape and texture features. IEEE transactions on geoscience and remote sensing, 48(9), pp.3446-3456.

